 You can find a lot of network monitoring software from the internet, and lots of them are free to use.
And of course you'd hear a lot that the best and reliable network monitoring softwares are running on the Linux/UNIX platform.
Luckily nowadays, many network monitoring softwares can run on Windows platform, I have nothing against Linux/UNIX system, but for newbies, learning about networking is hard enough, not to mention having to learn Linux/UNIX system.
But for a network engineer, knowledge about operating systems available in the market is a must.
For now, if you used to Windows platform, then it's easier to use network monitoring software such as PRTG.
It's very easy to install, in fact anyone whose ever installed softwares before can surely install PRTG.
So skip on how to install PRTG and start on configuring PRTG to monitor your network.
After installation, you can access PRTG from your system tray, by the way PRTG monitors your network all the time and informs you for anomalies in your networks.
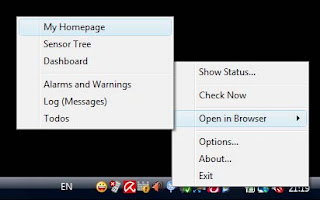
Provide the correct username and password, you would then be taken to the PRTG main interface in your default internet browser:
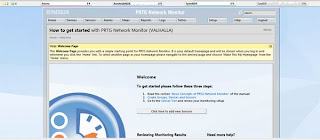
Notice at the top of the view, you can see the Global Status Bar, it shows the summary status of the sensors that you applied for network monitoring.
The interface is very easy to use, click on the desired feature you want to set and you'd be provided with information on that feature. You can even right click and do some contextual features from that right click menu.
For now, I want to set PRTG to monitor my Access Point. I have a Cisco Aironet 1240AG in my network and I want to monitor the traffic going in and out of the interfaces/ports.
First go to the "Devices" menu and click the "Add new device"
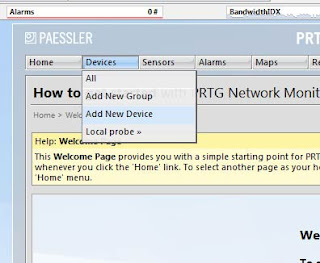
It will take you to the next screen, you can create a new group for your network devices here or add the network device to the existing group, click on continue.
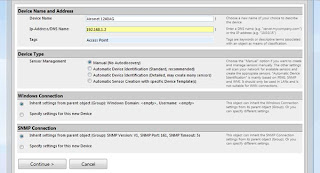
Fill in the information about the new device here, the device name, ip address of the device, tag to identify the device.
Next I just leave the Device Type option to default (Manual), and go straight to the Windows Connection menu.
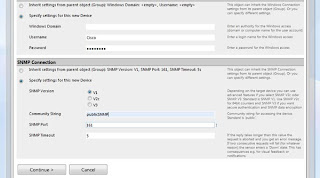
Set up the username and password to access my Access Point, then at the lower menu, I set the SNMP Community String of the Access Point.
I already set the SNMP Community String to be publicSNMP.
SNMP or Simple Network Management Protocol is basically a protocol used to monitor status of network devices. SNMP will send out information about the status of the device in a set of time interval.
And the SNMP Community String is kinda like username and password so not everybody can see what information sent out.
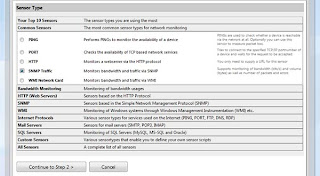
Click again the continue button and you will be given a bunch of sensors that you can apply on the network device.
As I said, I want to monitor the traffic going in and out of the Access Point, so I click on the SNMP Traffic option.
Next screen is where you choose and apply the configuration of the sensor. Cisco Aironet 1240AG has Dot11Radio0 (802.11B/G), Dot11Radio1 (802.11A), FastEthernet, and the BVI interfaces.
I don't use the 802.11A so I'll choose the 802.11B/G and FastEthernet interfaces only.
BVI is a Bridge Virtual Interface, it summarizes all the interfaces of the network device so you don't need to remember different ip addresses applied to the interfaces, you only need to remember the BVI ip address and use it to access your network device.
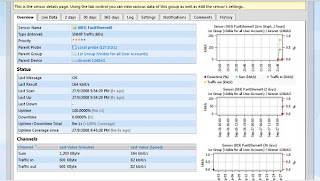
At last you can see the status of the interfaces that PRTG monitors, it has text and visual view. I don't have many things going on in my network so you won't see many traffic here.
Easy to use isn't it, so happy


